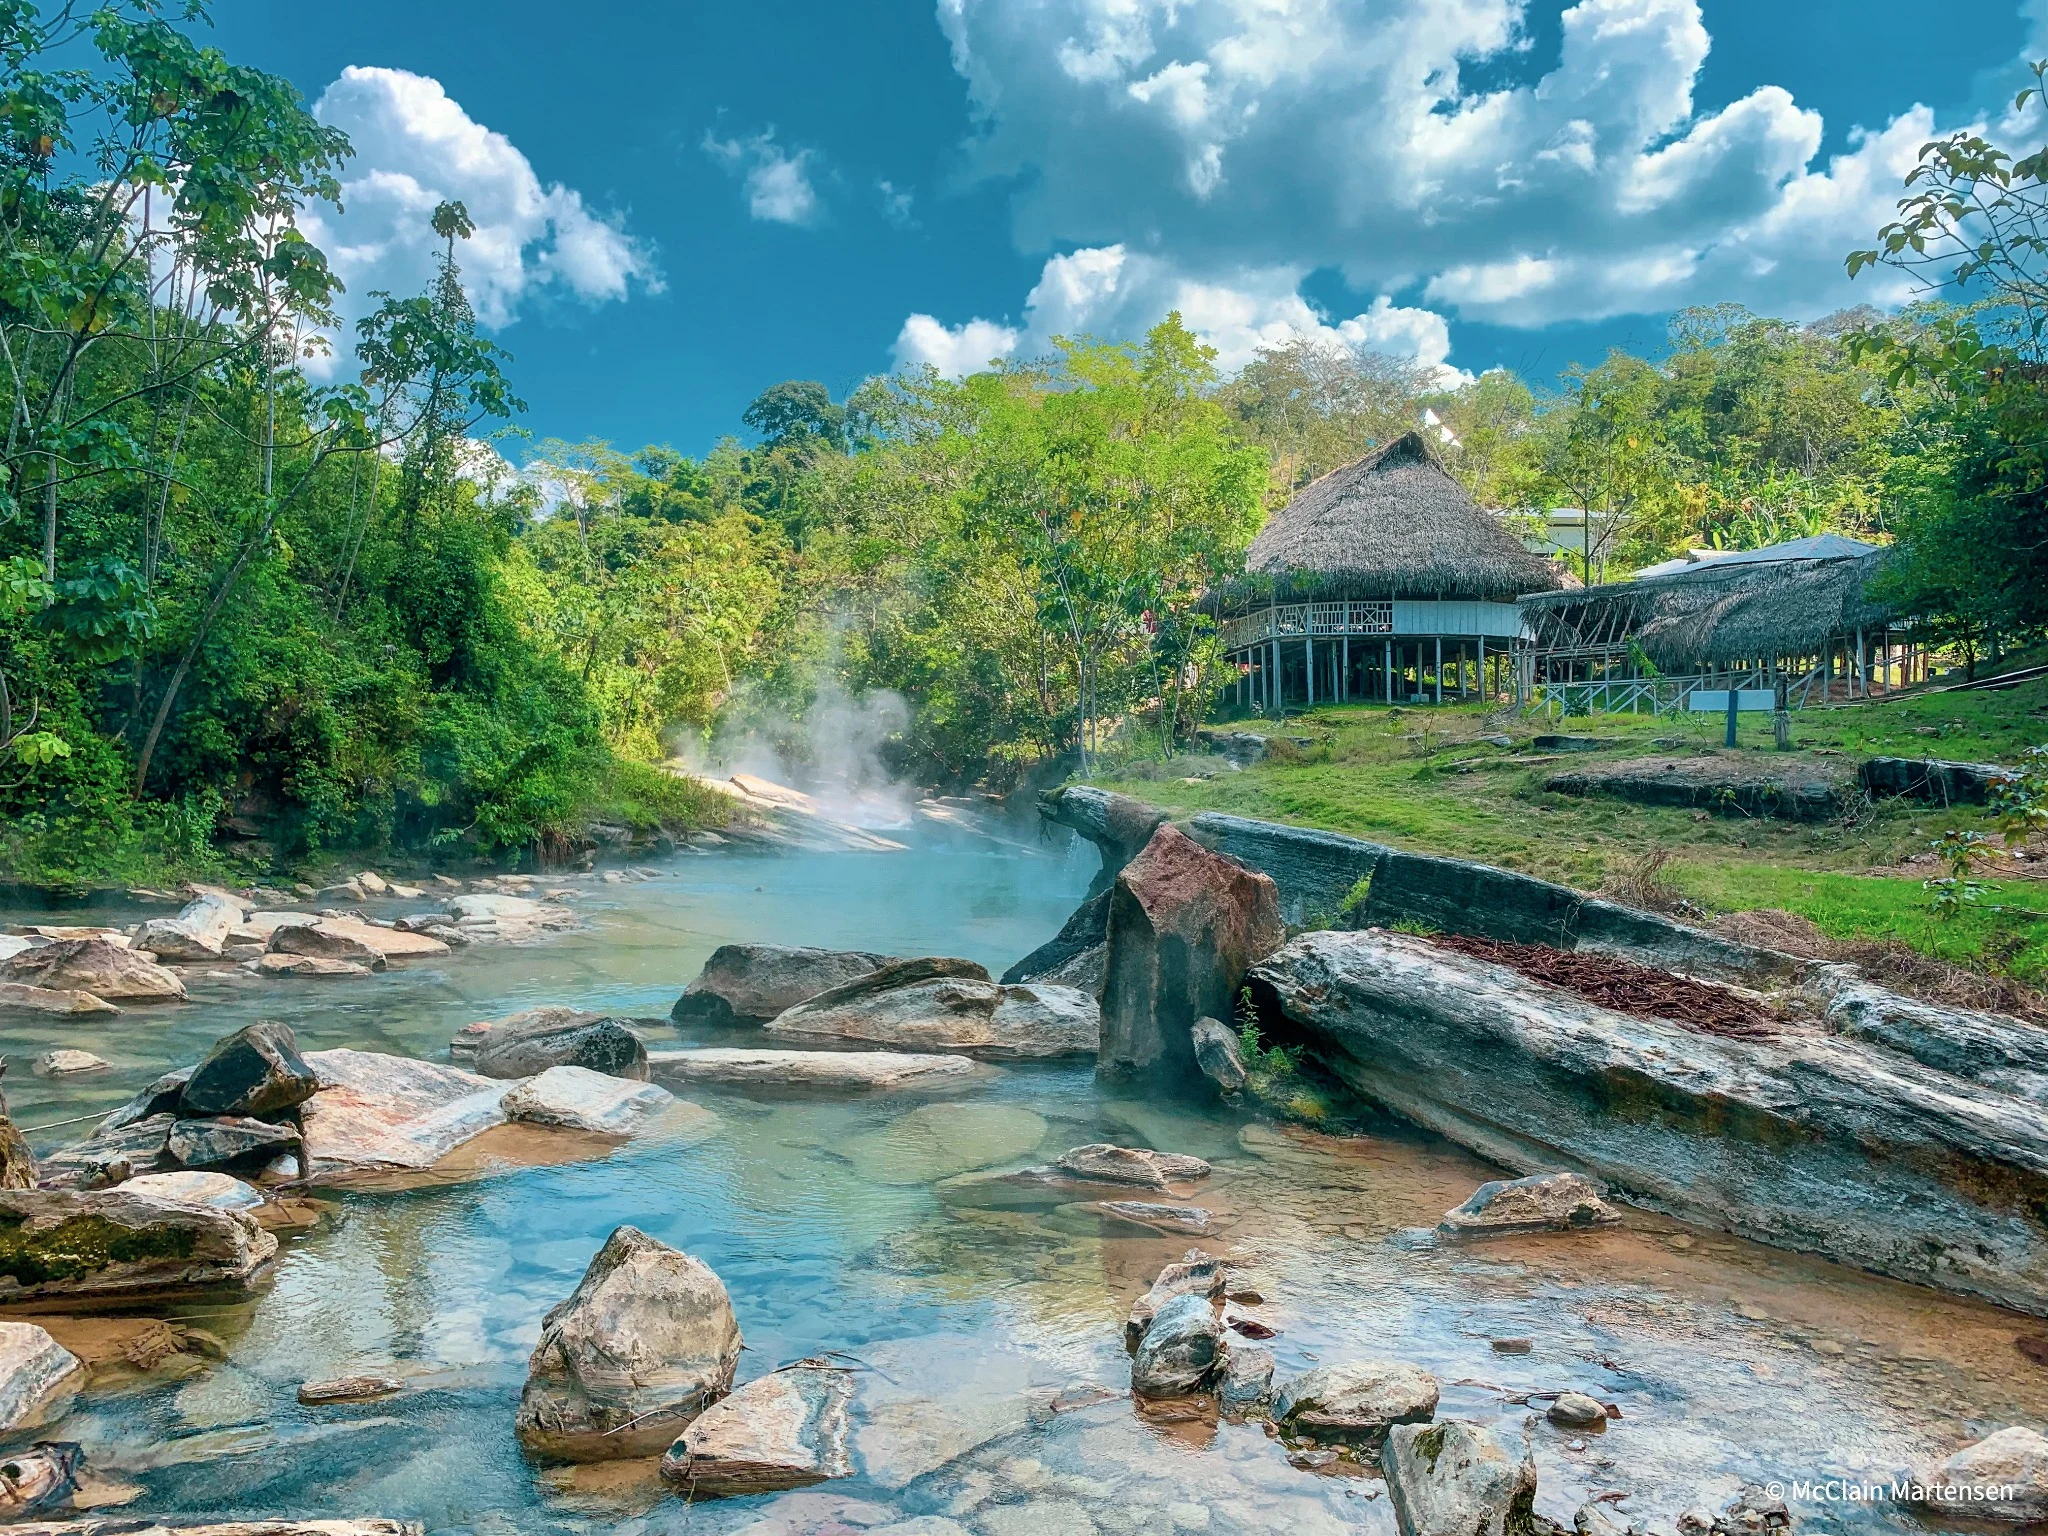
Understanding a landscape
we couldn’t walk through.
Deep in the Peruvian Amazon, the Boiling River—Shanay-Timpishka—is a sacred geothermal landscape with water that can approach boiling temperatures. Its remarkable heat and distance from active volcanoes have made it the focus of scientific investigation led by Andrés Ruzo.
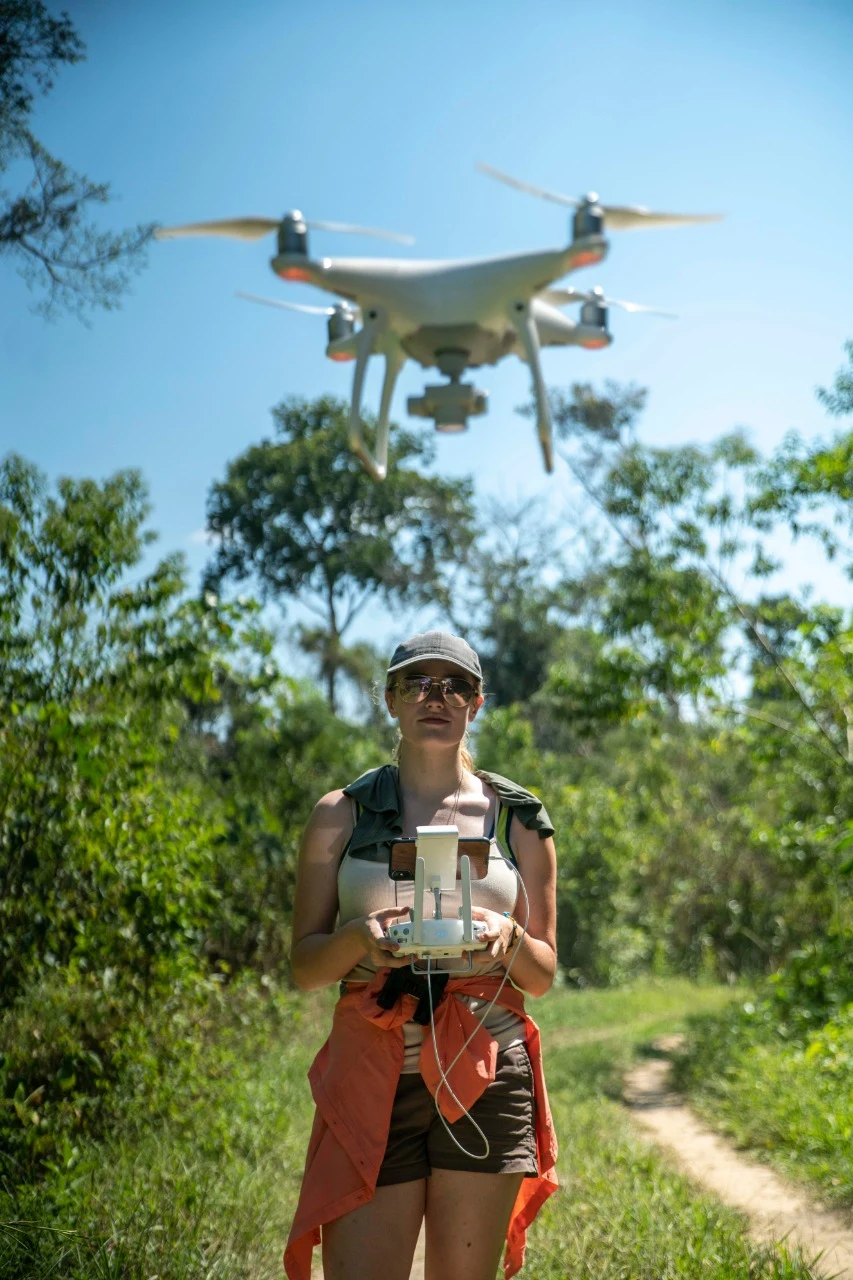
I joined Andrés in the field to create detailed drone-derived orthomosaics: aerial photographs processed into a continuous, georeferenced image. These maps gave the team a closer view of the river’s geomorphology without requiring researchers to enter its dangerously hot sections.
Conventional satellite basemaps lacked the detail needed to examine smaller river features. Drone imagery provided a practical way to document the channel, surrounding forest, and places that were difficult to reach on foot.
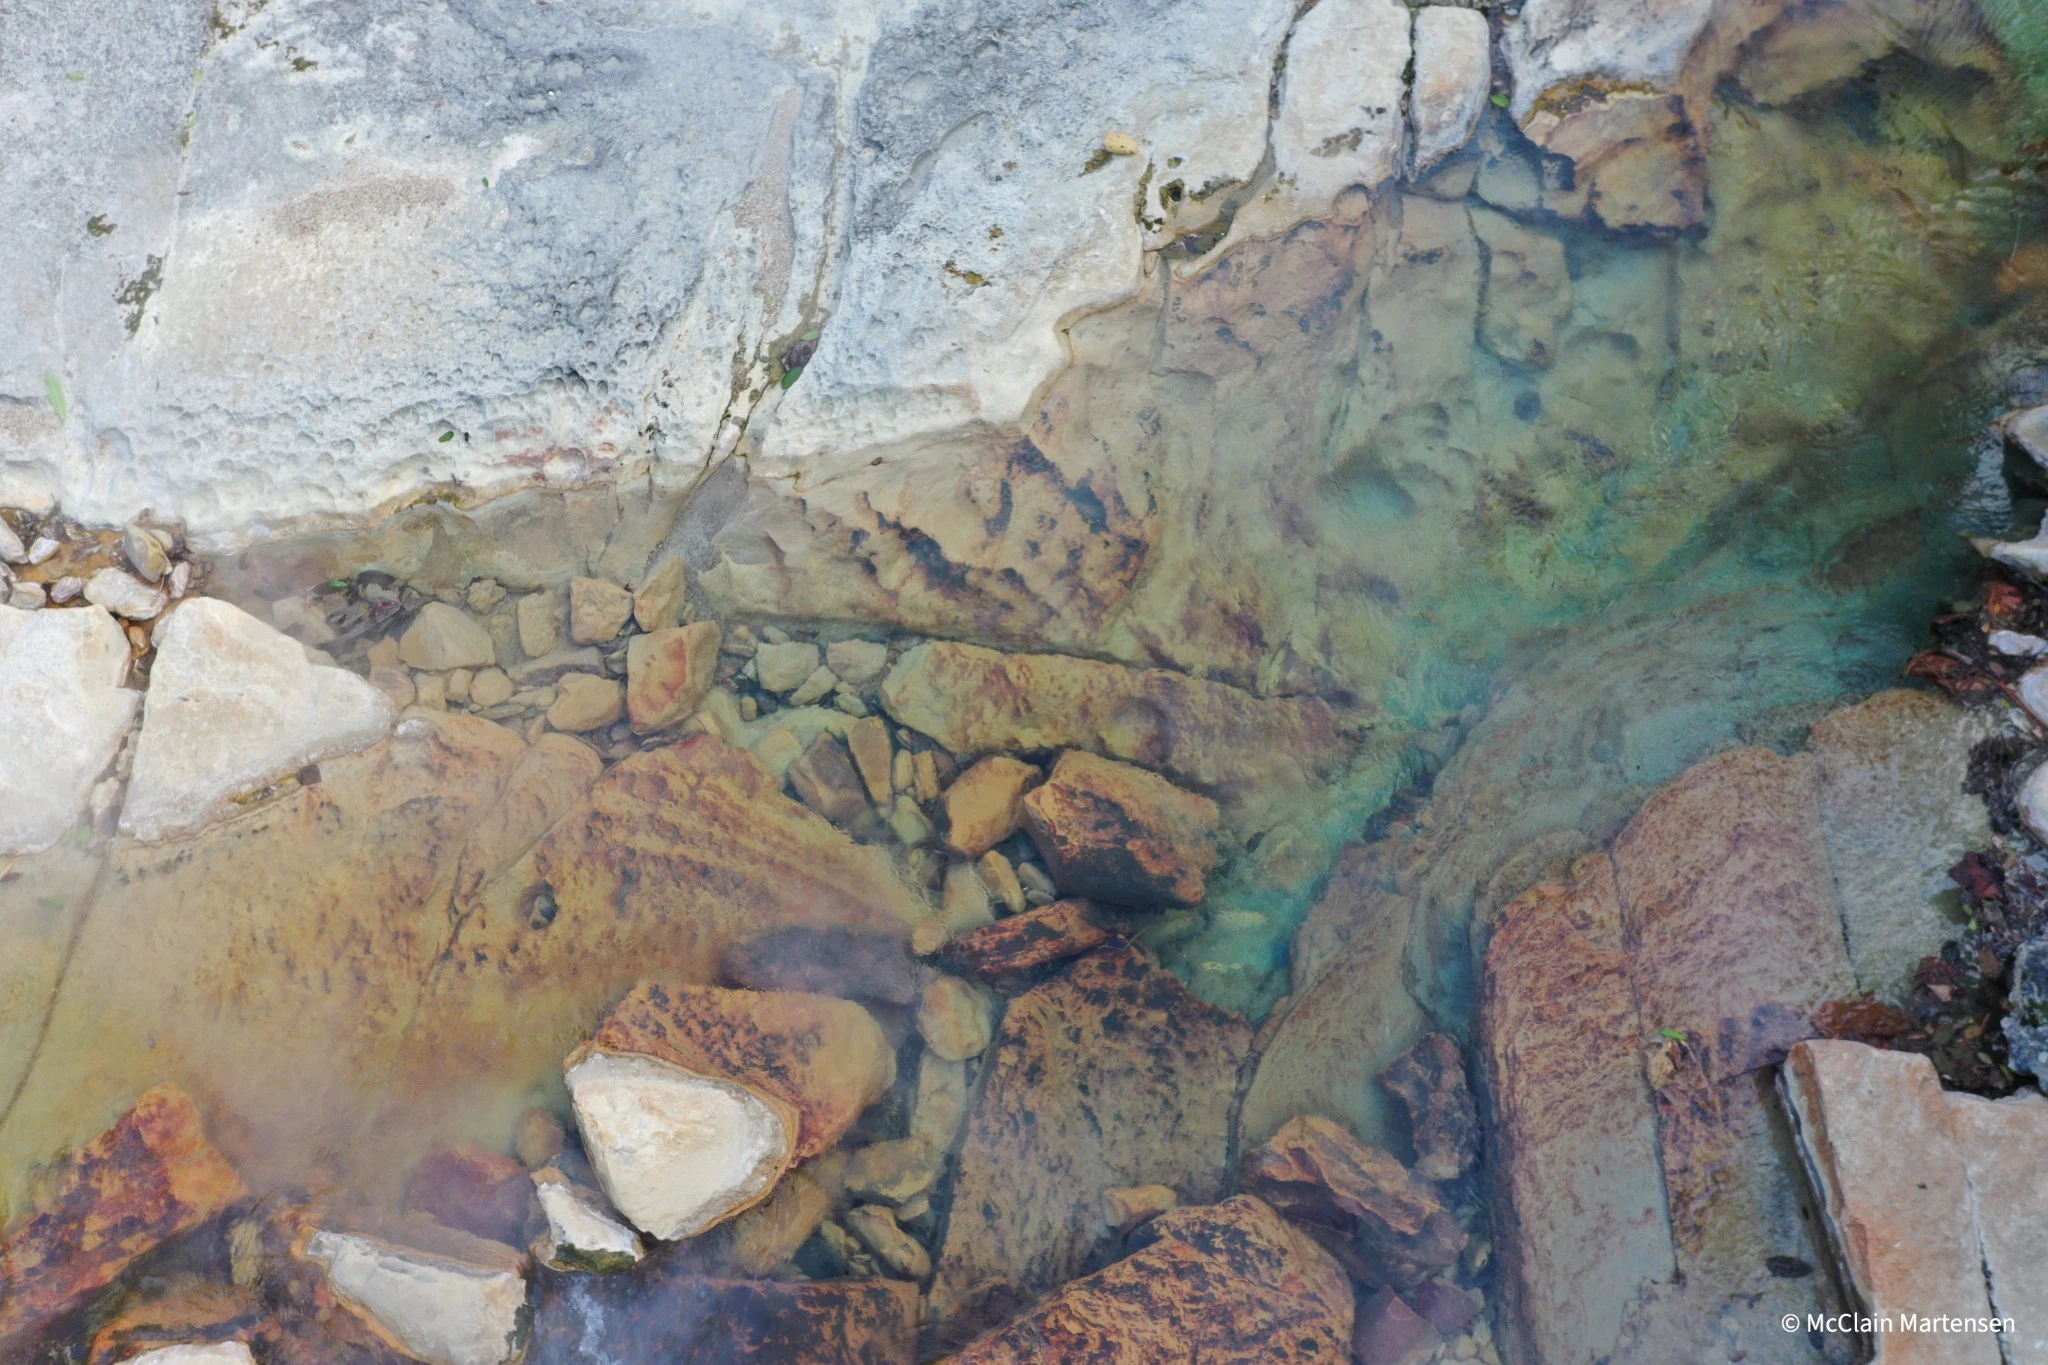
From aerial photographs
to a research basemap.
I collected imagery during the 2018 and 2019 expeditions using a Phantom 4 Pro and Mavic 2 Pro. Back in the lab, I extended that fieldwork into a 2021 research project examining how to improve orthomosaic processing in dense forests.
The challenge wasn’t simply taking more photographs. Similar-looking canopy, changing sunlight, water reflections, and limited access for surveyed ground control all affected the quality of the reconstruction.
Collect & organize
Organize overlapping UAV photographs and flight datasets, keeping the field conditions and coverage in view.
Compare processing methods
Evaluate ArcGIS Pro and Pix4D outputs across different image counts and overlap settings.
Evaluate light & image matching
Test color balancing and inspect how sun position, canopy texture, and reflections affect the mosaic.
Assess uncertainty
Review tie point density, image overlap, photo connectivity, flight coverage, and GPS position residuals.
A clearer view.
A more useful foundation.
The orthomosaics made river and landscape features visible in much greater detail than the satellite imagery used for comparison. They also offered a shared spatial reference for the team’s ecological, microbiological, and ichthyological research.
In my 2021 processing comparison, ArcGIS Pro offered more useful controls for georeferencing, color balancing, and editing tie points. The presentation documents the tests and quality checks behind that choice.
These are visual and processing assessments, not a claim of independently validated survey accuracy. Merging a complete area basemap and investigating flow, volume, and fault features were identified as future work in the presentation.
One landscape.
Many lines of inquiry.
My mapping supported a wider community of researchers and educators working around the Boiling River. A shared view of the landscape helped connect questions about geology, biodiversity, and conservation.
Dr. Rosa Vásquez Espinoza
A chemical biologist, National Geographic Explorer, and conservationist whose work connects Amazonian biodiversity, science, and ancestral knowledge. My maps supported research initiatives connected to her work at the Boiling River, alongside the broader expedition’s studies.
Her wider work offers an inspiring view of how scientific research and community knowledge can support the protection of the Amazon.
Explore Rosa’s research & conservation work ↗Projeto Mantis
Explore another research initiative connected to the project’s broader biodiversity work.
LSU ichthyology
Prosanta Chakrabarty’s firsthand account of studying fish around the Boiling River during the 2018 expedition.
Expedition Schnekser
Field science and education, connecting expedition experiences with learning.
The Boiling River Project
Andrés Ruzo’s nonprofit, dedicated to protecting the river through scientific research and education.
Beyond the finished map.
The fieldwork, people, and landscape behind the project. Select a photograph for a closer look.
See the expedition
in motion.
River travel from above
Original expedition footage · August 9, 2018
Morning over the rainforest
Original expedition footage · August 14, 2018
Optimizing Orthomosaic Modelling with UAV Imagery in Highly Dense Forests Using GIS
The complete 40-page presentation, including processing comparisons, lighting tests, uncertainty models, and lessons learned.
If the reader is unavailable on your device, use Open PDF or Download.
Follow the research.
Project methods and figures are drawn from my supplied research presentation. Linked sources provide background on the river and the wider research community.